Gas & Blobs
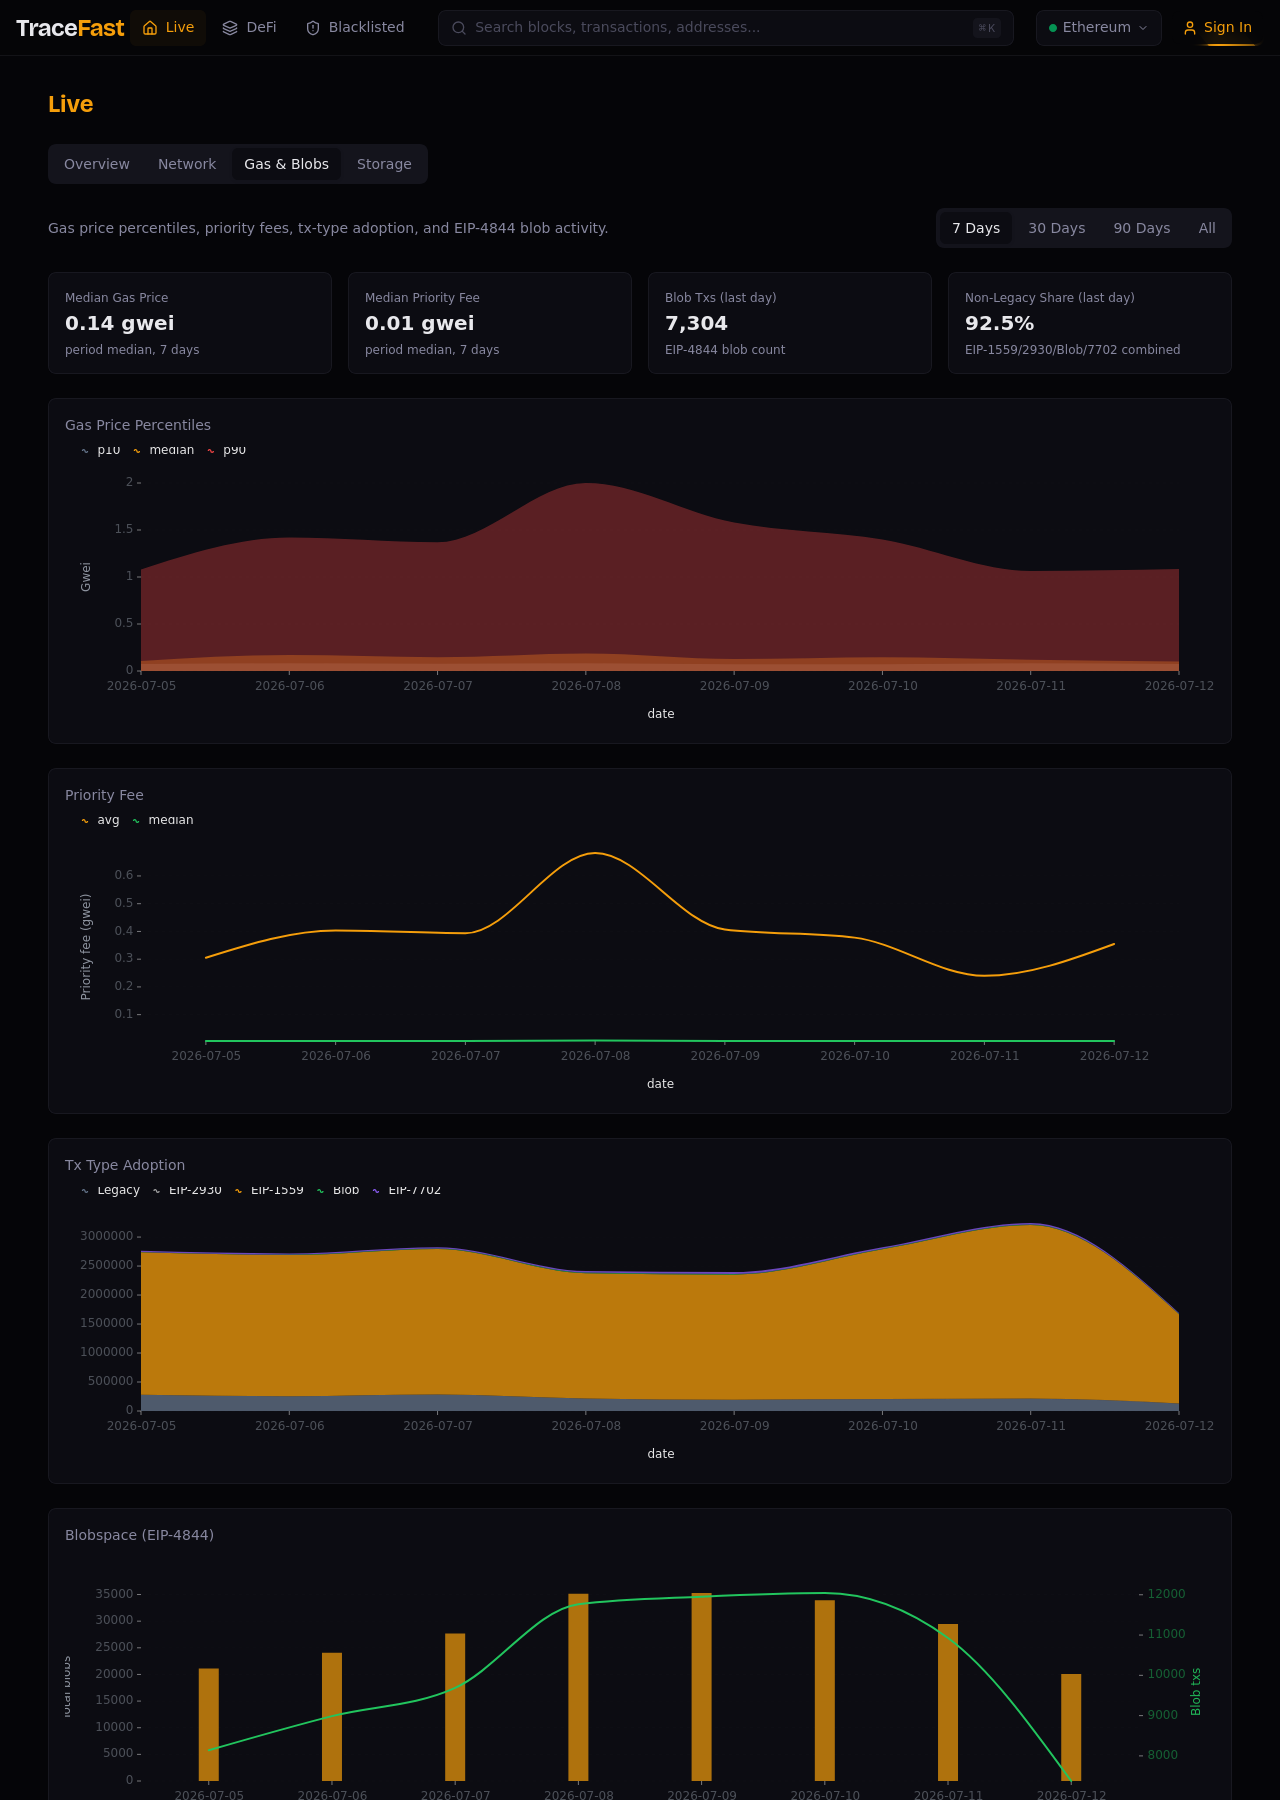
What it shows
The Gas & Blobs tab charts the fee market over 7, 30, 90 days, or all time:
- Median gas price and median priority fee — headline KPIs for the period
- Gas Price Percentiles — p10 / median / p90 gas prices as bands over time; the spread between p10 and p90 is congestion volatility
- Priority Fee — average and median tips over time
- Tx Type Adoption — the Legacy → EIP-1559 → blob → EIP-7702 migration as a stacked area
- Blobspace (EIP-4844) — blob transactions and total blobs per day, the pulse of rollup data posting
How to read it
Sub-gwei median gas is the post-blob-era normal; watch the p90 band for what heavy users pay in spikes. The Non-Legacy Share KPI (typically >90%) tracks how completely the ecosystem has moved to modern transaction formats. Blobspace trends are effectively a rollup-adoption chart — more blobs means more L2 batches landing.
Data & update cadence
Aggregated daily over the selected period. For the live per-block fee picture, use Transaction Economics.
Related pages
- Transaction Types — the live-window type mix
- Gas & Fee Distribution — per-block distribution detail