Network Stats
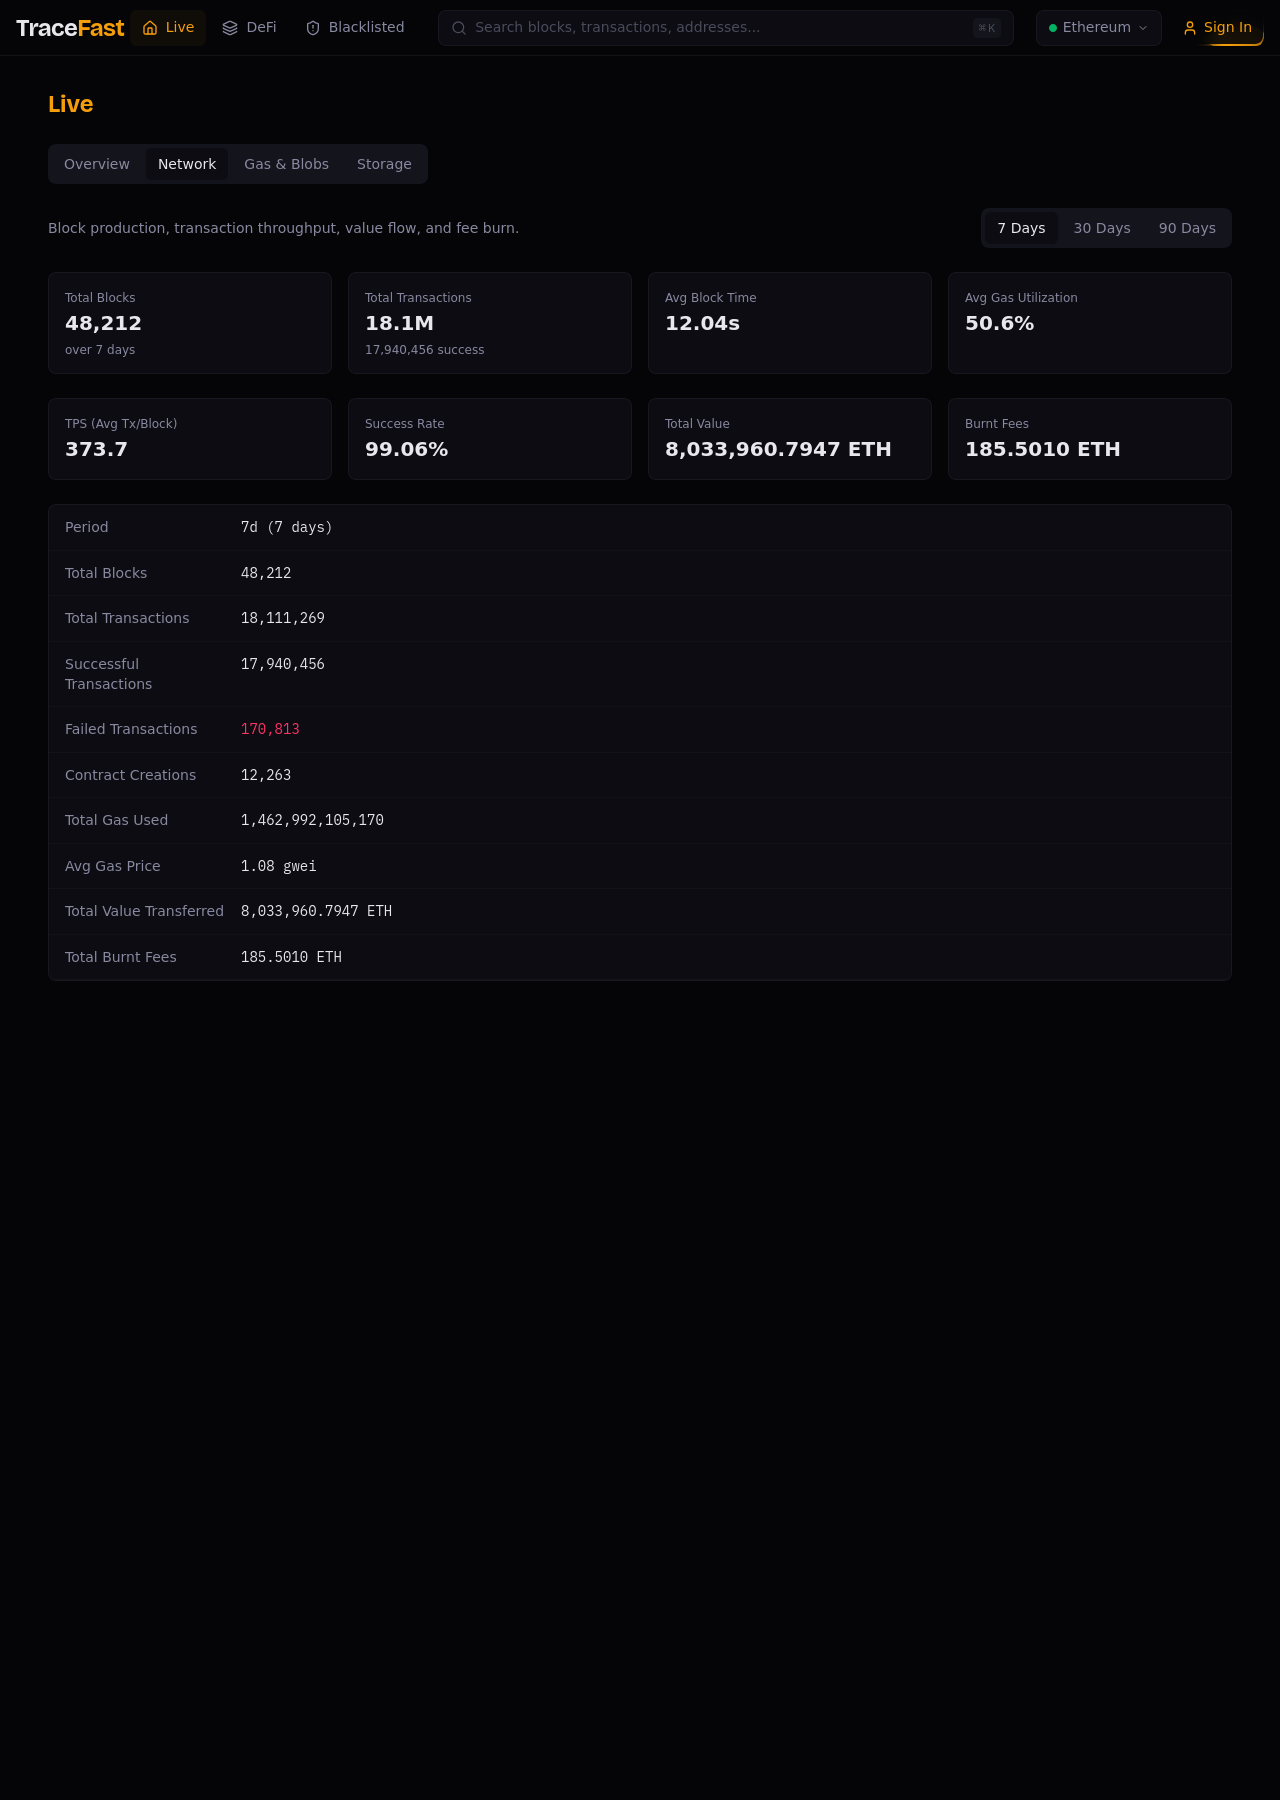
What it shows
The Network tab of the Live section steps back from the block-by-block view to network health over a selectable period — 7, 30, or 90 days:
- Total blocks and average block time — production regularity (~12 s is the protocol target)
- Total transactions, success rate, and TPS — throughput and its quality
- Average gas utilization — how full blocks run relative to the gas limit (50% is the protocol's equilibrium point)
- Total value transferred and total burnt fees — the economic volume the network settled, and the ETH destroyed doing it
A summary table repeats the same figures with exact values, including failed transactions and contract creations.
How to read it
This tab is your baseline. When a live widget looks unusual — TPS spiking, failures climbing — compare against the period averages here to tell a blip from a trend. Gas utilization drifting above 50% for weeks means sustained demand pressure; burnt fees track it directly.
Data & update cadence
Aggregated daily over the selected period (7/30/90 days) — unlike Overview widgets, this is not a rolling live window.
Related pages
- Block KPIs — the same metrics, one block at a time
- Gas & Blobs — the fee-market side of the same history