Live Dashboard
The Live Dashboard is TraceFast's home screen — a real-time picture of Ethereum, refreshed with every block, roughly every 12 seconds.
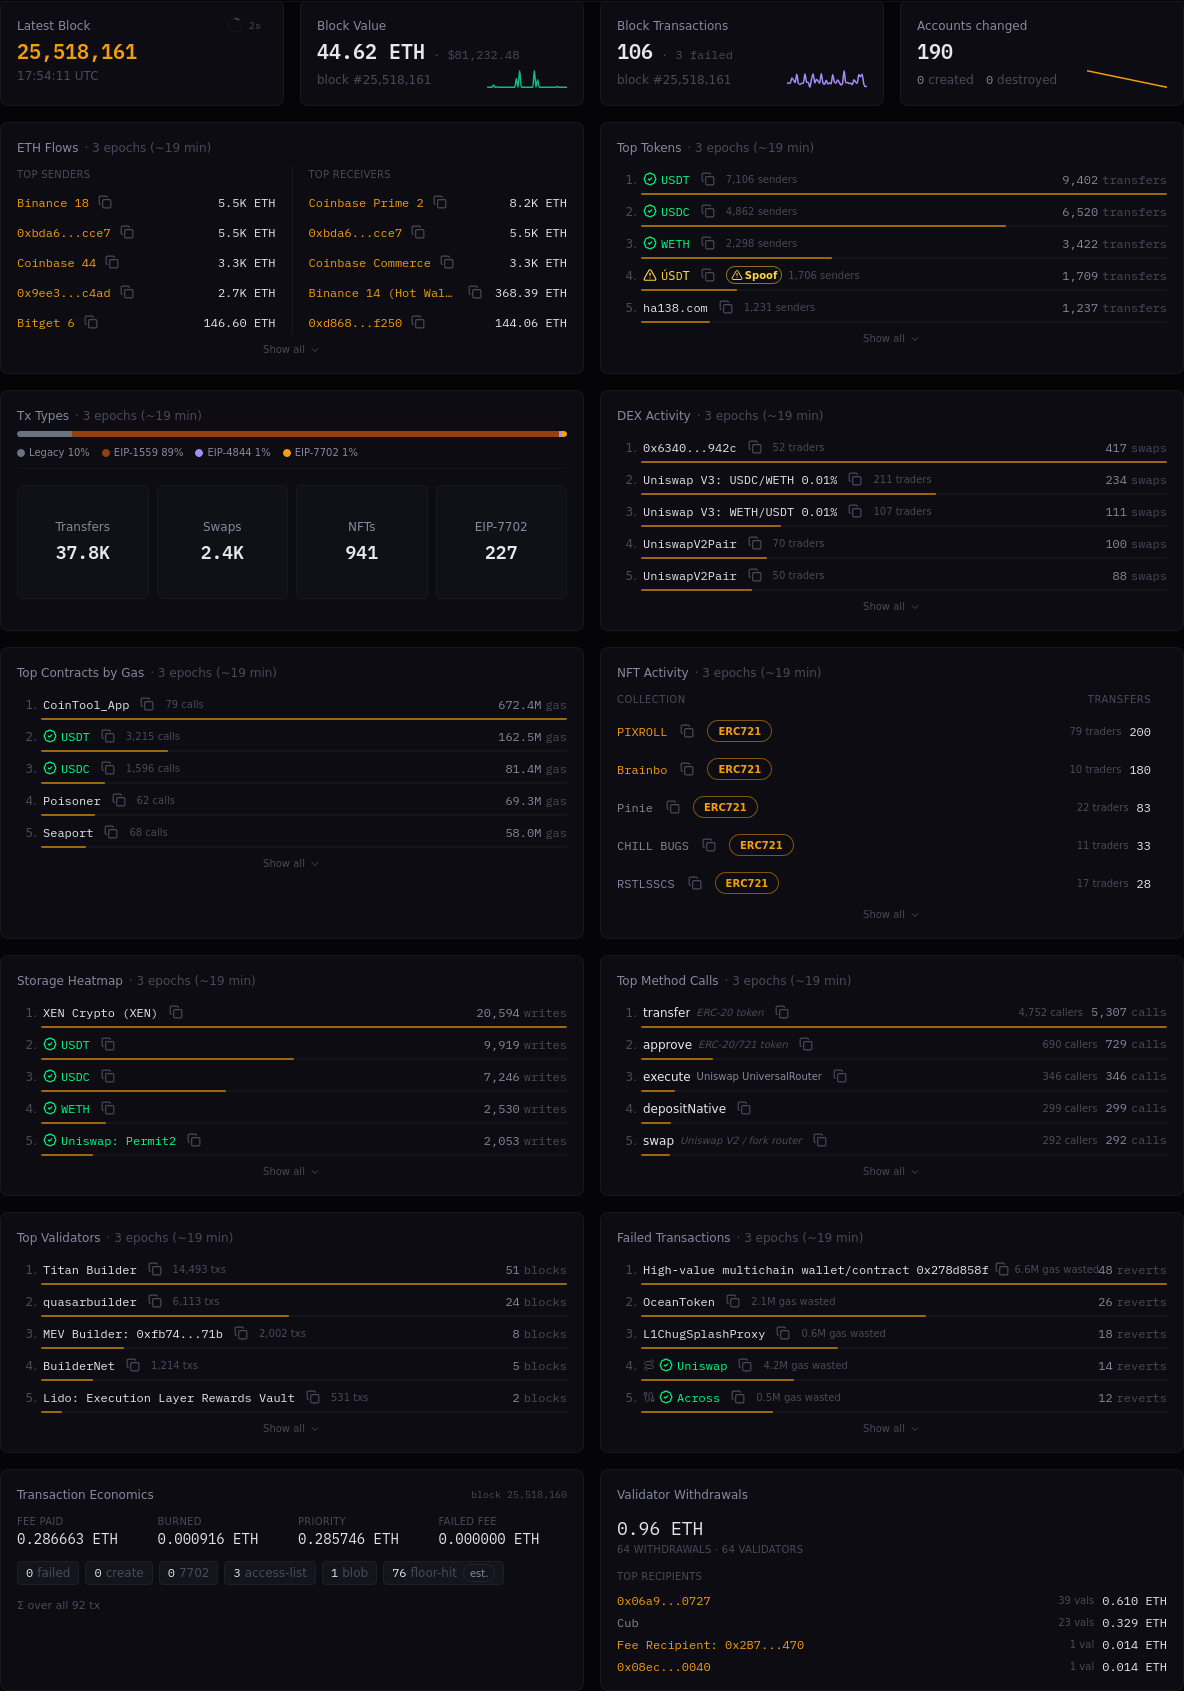
The four tabs
- Overview — the live view. Block KPIs on top, and below them a grid of widgets covering value flows, tokens, DEX trading, contracts, validators, and more.
- Network — historical network statistics over 7, 30, or 90 days: block production, throughput, value transferred, fee burn.
- Gas & Blobs — gas price percentiles, priority fees, transaction-type adoption, and EIP-4844 blob activity over time.
- Storage — contract storage write activity: who writes the most state, and how.
Live data and the aggregation window
Widgets on the Overview tab carry a window marker: “3 epochs (~19 min)”. An epoch is Ethereum's consensus unit of 32 slots of 12 seconds each — about 6.4 minutes. Overview widgets aggregate over a rolling window of the last three epochs, so they show what the network is doing right now, not all-time totals. Each new block updates the window.
Overview widgets
| Widget | What it tracks |
|---|---|
| ETH Flows | Top senders and receivers of ETH, with labels |
| Top Tokens | Most transferred tokens |
| Transaction Types | Legacy / EIP-1559 / EIP-4844 / EIP-7702 mix |
| DEX Activity | Most active trading pools |
| Top Contracts by Gas | Biggest gas consumers |
| NFT Activity | Collections by transfers and traders |
| Storage Heatmap | Contracts writing the most state |
| Top Method Calls | Most called contract methods |
| Top Validators | Block producers in the window |
| Failed Transactions | Reverts and wasted gas |
| Transaction Economics | Per-block fee breakdown |
| Validator Withdrawals | Staking withdrawals per block |
| Gas & Fee Distribution | How fees spread across transactions |
Every name, address, and pool inside a widget links into the Explorer — the dashboard is a starting point, not a dead end.