DEX & Tokens
Open the DEX market in TraceFast →
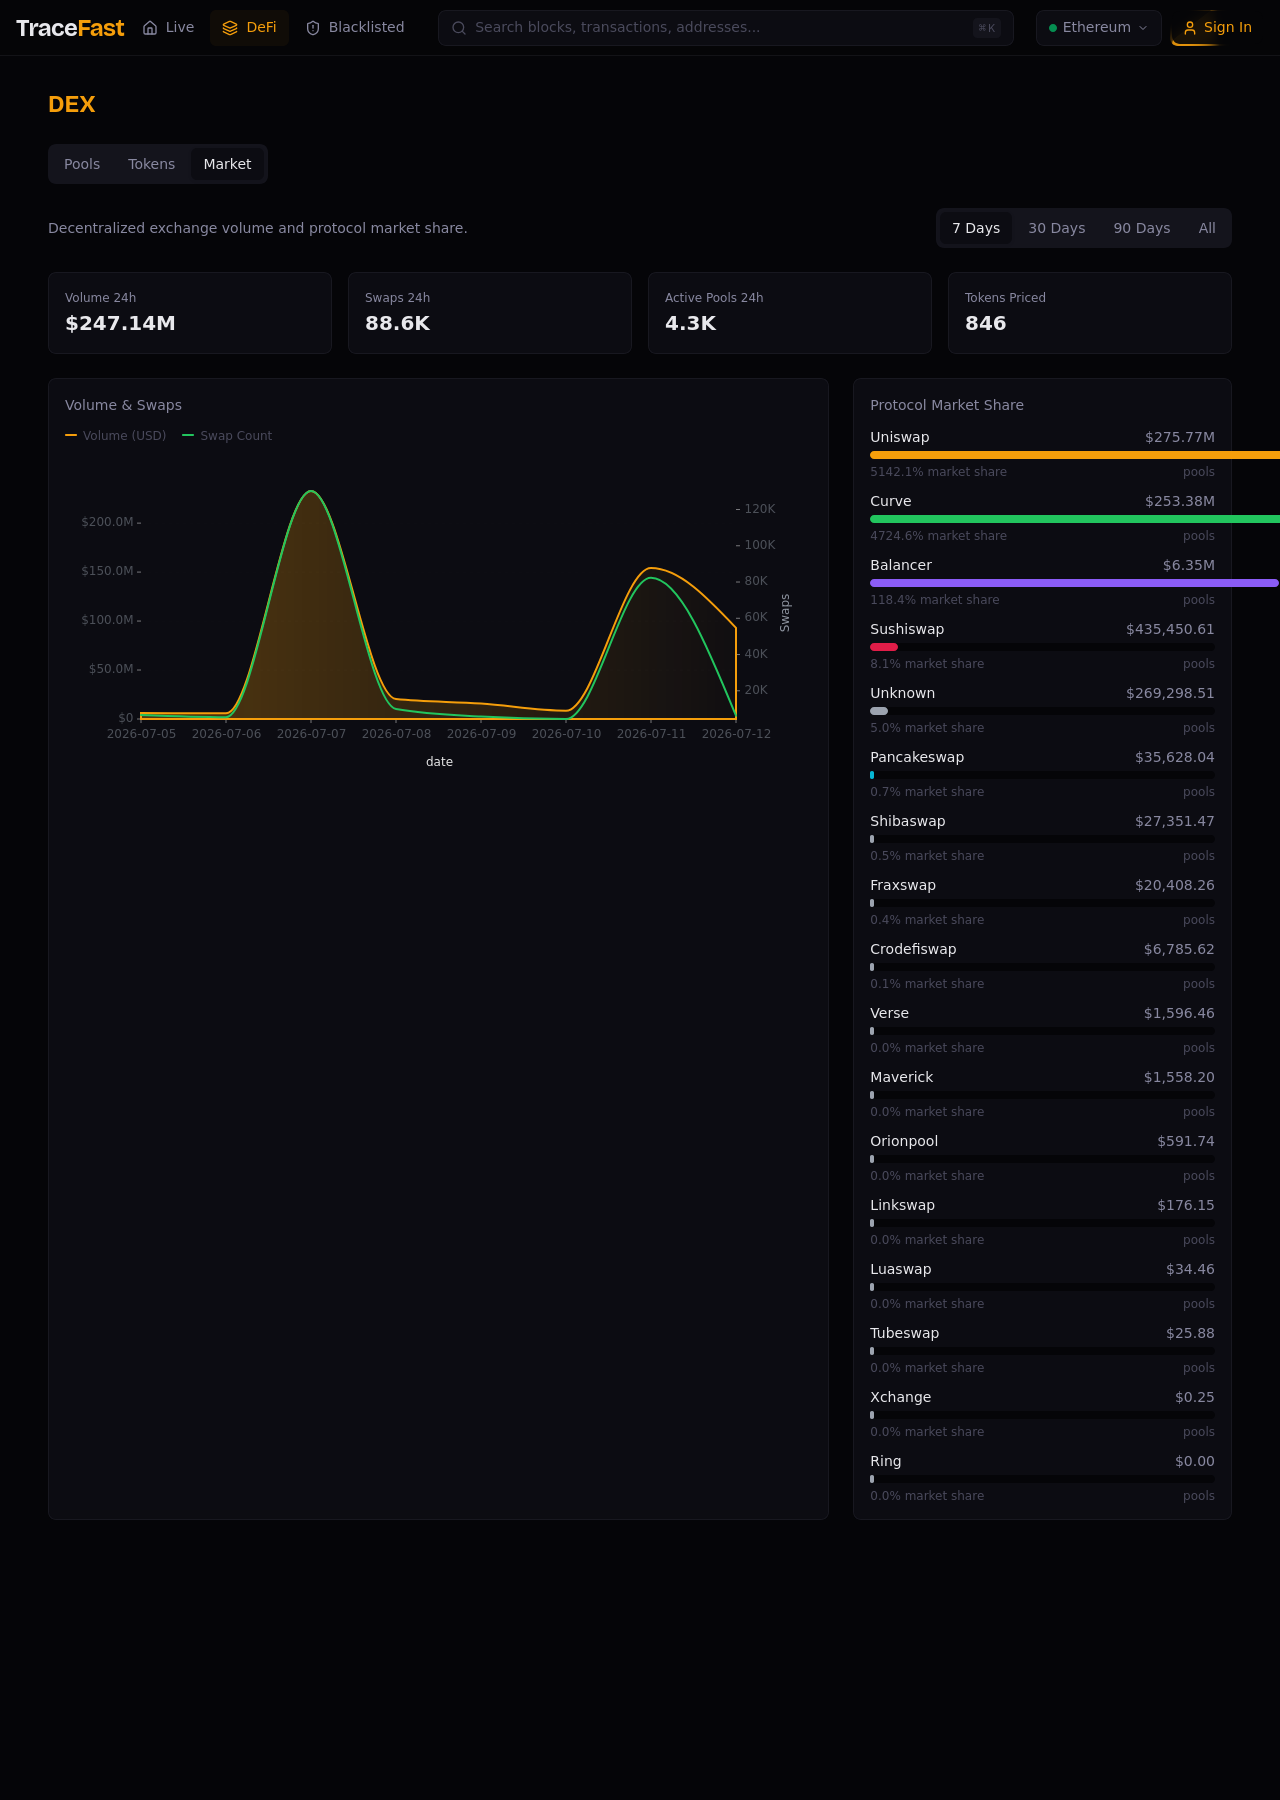
DEX is one of the four DeFi sections, and the only one with tabs of its own: Pools, Tokens, and Market. This page covers Market and Tokens; the Pools tab has its own page, Pools & Liquidity.
Market
/defi/dex — the aggregate view. Four KPIs cover the trailing 24 hours: volume, swap count, active pools, and tokens with live pricing. The Volume & Swaps chart puts USD volume and swap count on one timeline — divergence between them (volume up, swaps flat) means larger average trades. Protocol Market Share splits volume across DEX protocols, each with its volume, share and pool count: Uniswap and Curve typically dominate, with the long tail of forks and niche venues visible below.
Per-protocol dashboards
Each protocol in Protocol Market Share links to its own dashboard (/defi/dex/protocols/<protocol> — uniswap, curve, balancer, pancakeswap, sushiswap and the rest). It scopes the same picture to one venue: 7-day volume and swaps, total and active pool counts, a volume-and-swaps chart, and a breakdown by protocol version.
These dashboards are not the same thing as the Protocols section, a directory of DeFi protocols and their contracts that goes beyond exchanges. Like all of DeFi, both need sign-in (a free account is enough).
Tokens

/defi/dex/tokens — assets ranked by DEX trading volume over 24 hours, 7 days or 30 days, with price, volume, swap count, and the number of pools each trades in. Volume is USD where a price exists and native token volume where it doesn't, rather than silently dropping unpriced assets.
Pricing derived from actual swaps has a virtue centralized feeds lack: it reflects what the asset actually trades for on-chain, including thin and exotic pairs. Each token links to its own entity page for holders, transfers and pool membership.
How to read it
Sudden market-share shifts between protocols usually track incentive programs or new pool deployments. A token appearing in the priced list for the first time is often the first public record of its market existence.
Data & update cadence
Charts aggregate daily over the selected period (7/30/90 days or all time); KPI cards cover the trailing 24 hours.
Related pages
- DeFi Overview — how the section is laid out
- Pools & Liquidity — the third DEX tab, pool by pool
- Tokens — a token's own page: holders, transfers, pools
- DEX Activity — swaps in the live window
- Flash Loans — DeFi's most advanced maneuver
Last updated 22 Oct 2026, 08:06 UTC · verified against TraceFast v1.0.261 · Markdown