Blocks
Open the block explorer in TraceFast →

The block list
The block list is not a plain reverse-chronological feed. It leads with context and surfaces the blocks worth looking at before you start scrolling.
Network pulse — a one-line verdict on current conditions (High gas · Blob activity present) over a KPI strip: average gas utilisation, average base fee, TPS, average transactions per block, ETH burnt in 24h, and blob gas in 24h.
Interesting blocks — cards for anomalous blocks among the latest ones, with the number of blocks looked at in the heading (latest 100). Each card shows the signal that fired, the evidence behind it (164 failed tx · 45.4× recent baseline), and a quick action that jumps straight to the relevant rows. The panel sits on the first page only.
The table — one row per block: block number, age, a plain-language summary (Normal, or the signals that fired), transaction count, gas used, failed count, deployments, blobs, and the fee recipient (labeled where known, for signed-in viewers). Arrows beside a number mark it as high or low against the recent baseline. Rows expand in place for a preview without leaving the list. Sort by latest, transactions, gas used, value, fees, failure rate, deployments or blobs, and pick how many rows a page shows.
Signals
Signals are computed against a rolling recent baseline, so "unusual" means unusual for now rather than against a fixed threshold:
| Signal | What fired it |
|---|---|
| Failure spike | Reverted transactions far above the recent baseline |
| Deployment burst | An unusual number of contract deployments in one block |
| Blob-heavy | Large share of blob gas consumed (EIP-4844) |
| Full block | Gas utilisation at or near the block limit |
| High log density | Unusually many logs per transaction |
| Risky recipient | The fee recipient carries a risk label |
| Large value | Native ETH moved far above baseline |
| Low activity | Unusually few transactions |
Signal pills act as filters — clicking one narrows the table to blocks where it fired.
Pulse and Forensic lenses
The list has two column sets:
- Pulse (default) — the operational view: throughput, gas, value, recipient.
- Forensic — the investigative view: failure rate, failed and successful counts, deployments, logs per transaction, participants per transaction, and recipient risk. Participants counts every address that took part in the block in any role — sender, recipient, called contract, token holder, event argument — so an airdrop block stands out here.
A dash in a Forensic column means the figure is not computed for that block, not zero; its tooltip says which. Recipient risk relies on labels, so it is shown to signed-in viewers.
The lens lives in the URL (?lens=forensic), as do sort order and active signal filters, so a filtered view is shareable as-is. Switching lens keeps the filters and the sort.
The block page

A block page opens with four cards. The first names the fee recipient and Why this block matters — either No anomalies — a normal block, or the signals that fired with their evidence and quick actions (View 5 deployments). The other three are transactions (with the success/failed split, each half a link to those rows), total value moved (with its USD value at the block's hour), and base fee with the share of the gas limit used.
:::tip Total Value counts ETH only
The value KPI sums msg.value across the block's transactions. Internal transfers and token transfers are not in it, so a block full of stablecoin volume can read low here — check the Token Transfers tab for what actually moved.
:::
Tabs unpack the block:
- Overview — the dependency diagram (below), then block hash, timestamp, fee recipient (labeled where known), proposer, parent hash, blob transactions with blob gas and the running excess, withdrawals with their total, contract creations, participants, and log count. More Details expands to gas used, base fee per gas, total gas fees, burnt fees, tips, the state / transactions / receipts roots, difficulty, extra data and ommers count. Storage Activity closes the tab.
- Transactions — every transaction in the block, sortable and filterable.
- Token Transfers and NFT Transfers — the token movements the block produced, filterable by event type.
- Internal — native ETH moved by calls inside the block's transactions. A transaction's own top-level transfer is not repeated here; it is on Transactions. A block that is not traced yet says so instead of claiming there were none.
- Participants — every address that took part in the block (below).
- Withdrawals — beacon-chain validator withdrawals credited in this block (present only when the block has any).
- Dependencies — which transactions read state that an earlier transaction in the same block wrote (below).
The fee recipient is the address the block's fees went to — often a builder, not the validator. The validator that proposed the block is the Proposer row: its index (a link to the validator's page) and slot. It is shown once the slot is final; until then the row says so.
Storage Activity — SSTORE count, transactions that wrote storage, average writes per transaction, maximum call depth, and the counts of transactions with a DELEGATECALL or a contract creation. It is summarised on an hourly cycle, so the newest blocks show Not computed yet — pending, not zero. See Data Sources & Freshness.
Participants
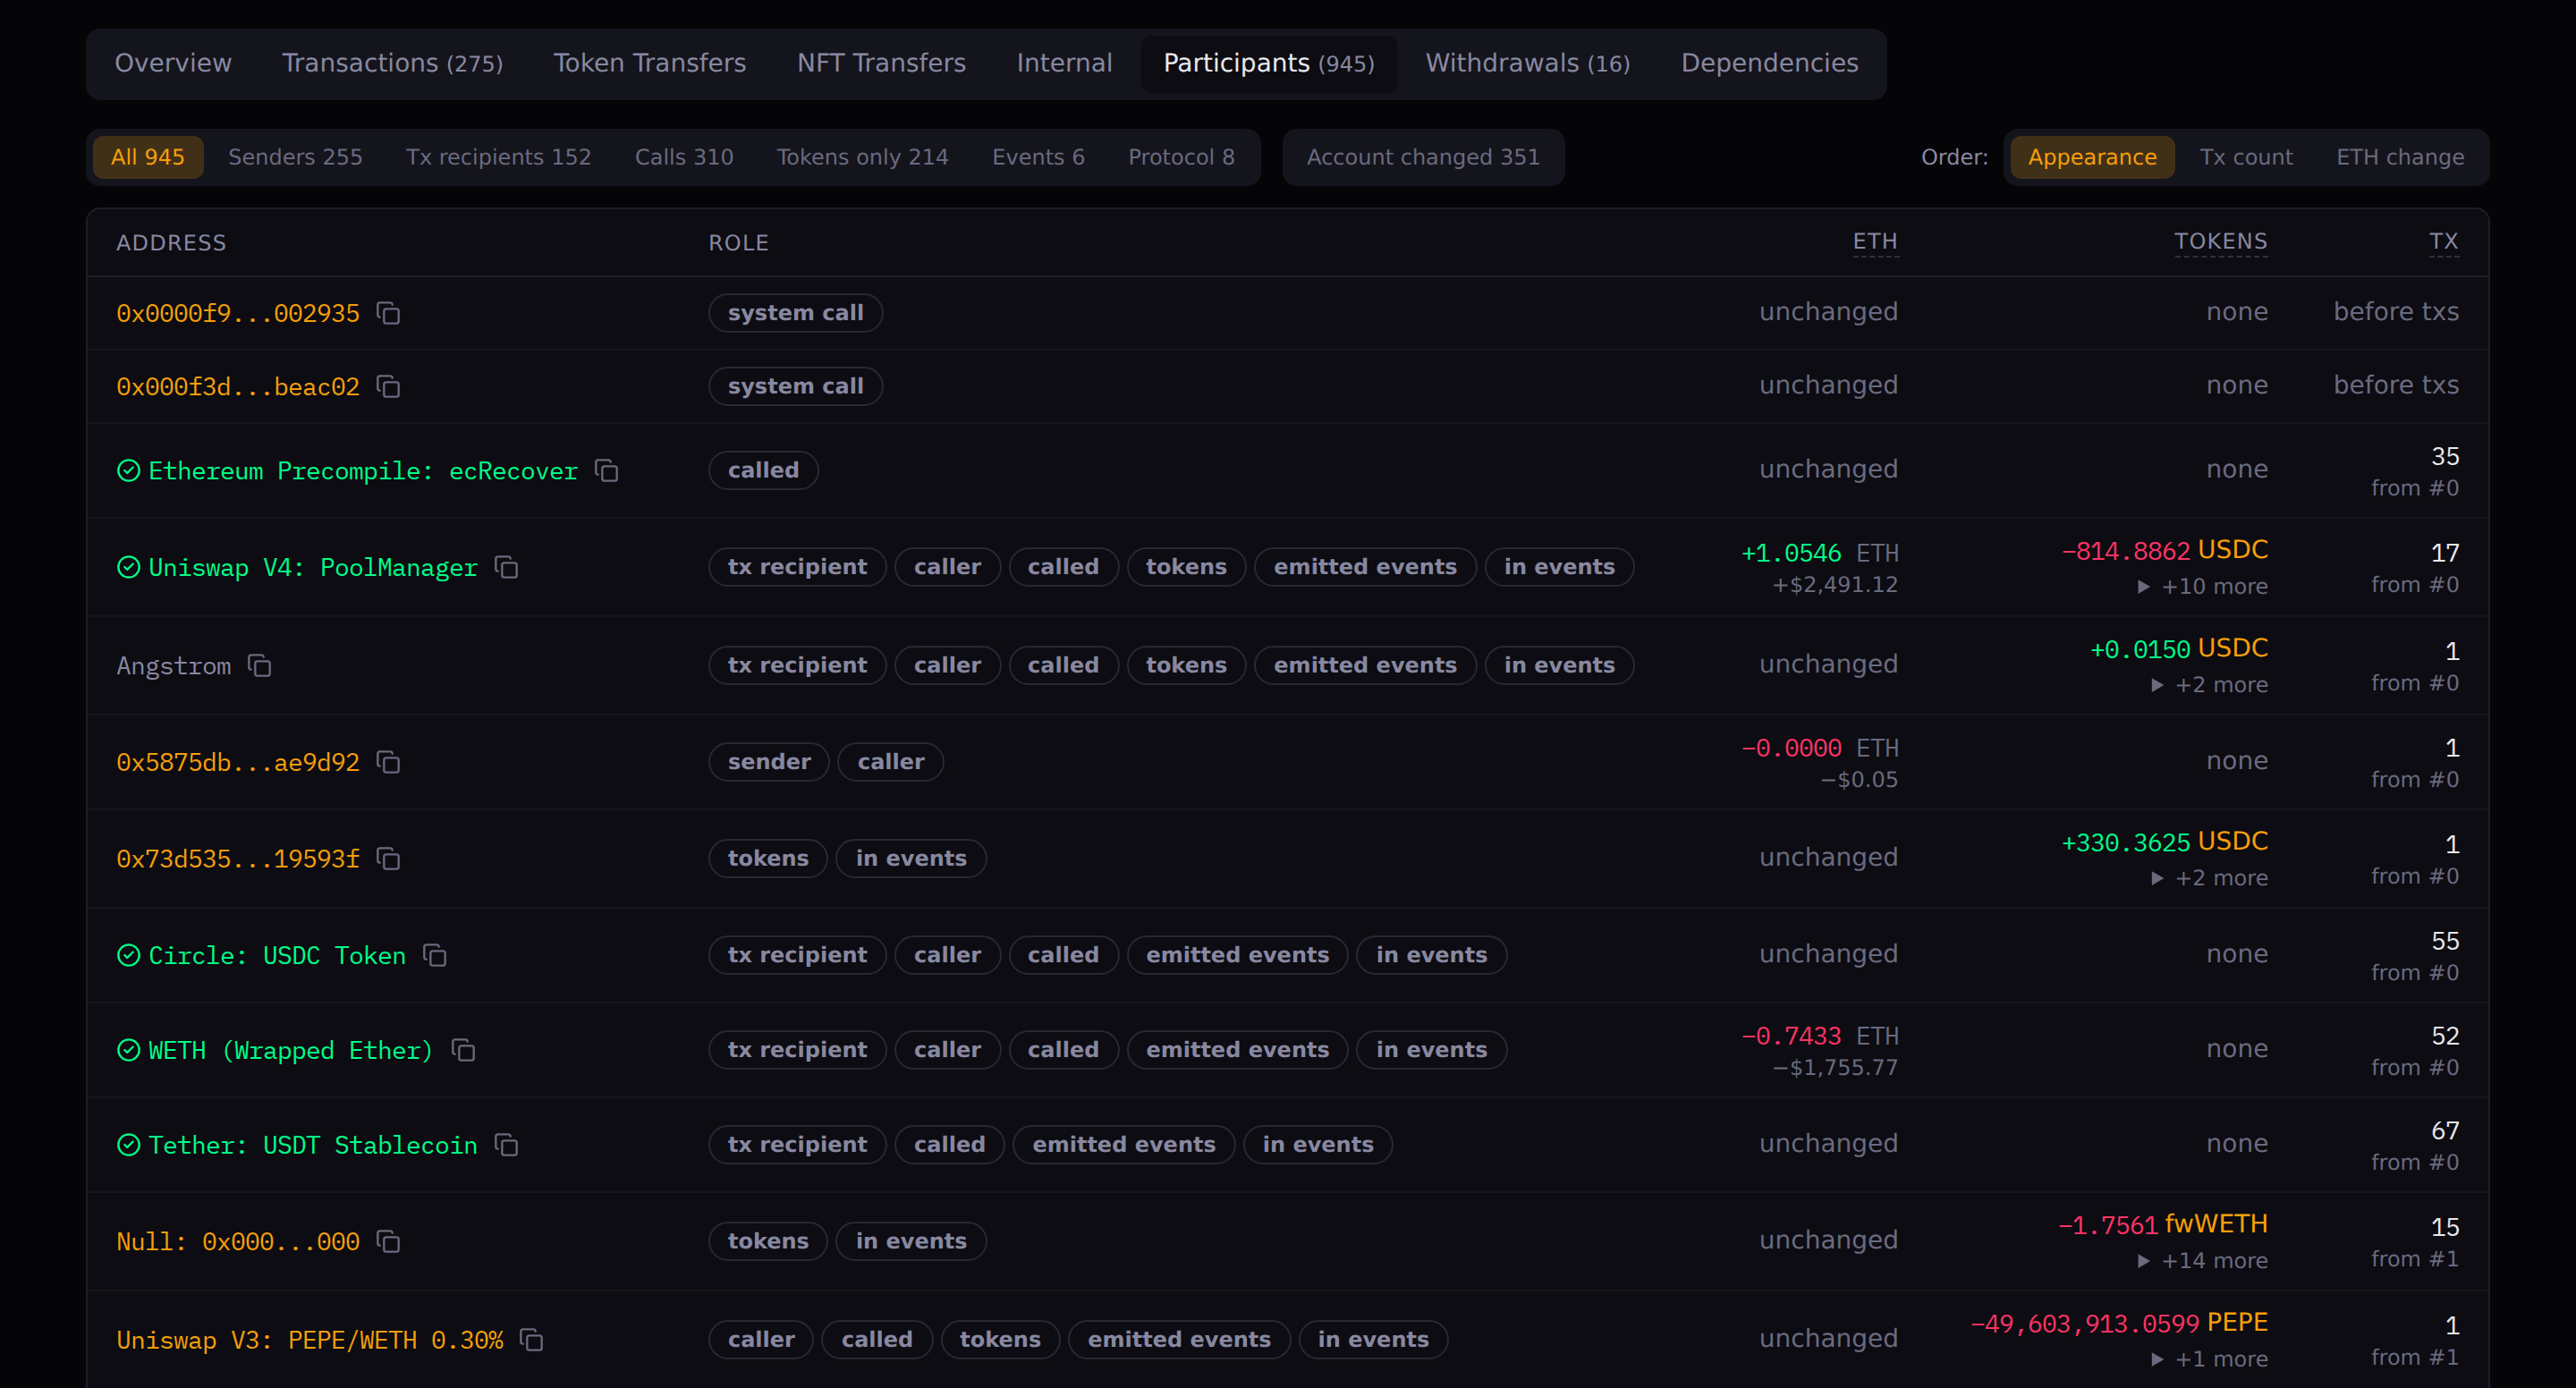
The tab lists every address that took part in the block, not only the ones whose own account changed. Chips split the list by kind — senders, transaction recipients, called contracts, addresses that only moved tokens, addresses that only appear in events, and protocol addresses — and Account changed shows the narrower set whose balance, nonce or code changed. Order rows by appearance, transaction count or ETH change.
Each row names all of the address's roles in the block (sender, tx recipient, caller, called, deployed, emitted events, 7702 signer and so on), its ETH change, its token flows, and the transactions it took part in. An address that acted outside any transaction — a system call before the first one, a withdrawal after the last — reads before txs or after txs in the transaction column. The count is marked provisional while the newest blocks are still being processed.
In a cell, unchanged is a fact, … means not counted yet, and — means the measure does not apply. Older links to ?tab=addresses open the Account changed view.
Dependencies
A transaction depends on an earlier one when it reads a storage slot that the earlier one wrote in the same block. The top of the Overview tab draws this as an arc diagram: transactions in block order along a line, an arc from each transaction to the earlier one whose write it read, thicker for more slots. A sentence names the strongest link and the transaction linked to the most others, and the two are highlighted differently. Hover a transaction or an arc for its links; click a transaction to open it.
The Dependencies tab lists every such pair: the transaction, the one whose write it read, the contract and the slot. The same facts for a single transaction are on its State tab.
Signed in, a star on a row of the transfer and internal feeds saves it to your Favorites.
Prev / Next step through the chain block by block, and ?tab= deep-links any tab.
Related pages
- Block KPIs — the same block facts, live on the dashboard
- Transactions — drill into any row
- Gas & Blobs — blob market and gas trends over time
- Storage Analytics — where storage writes concentrate
Last updated 22 Oct 2026, 08:06 UTC · verified against TraceFast v1.0.261 · Markdown